The last blog post left us in cruise enroute from Yellowknife to Edmonton International Airport. Enduring the usual cruise-boredom let us check the current wind and compare it to what we predicted during our pre-flight preparation.
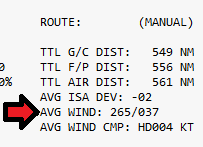
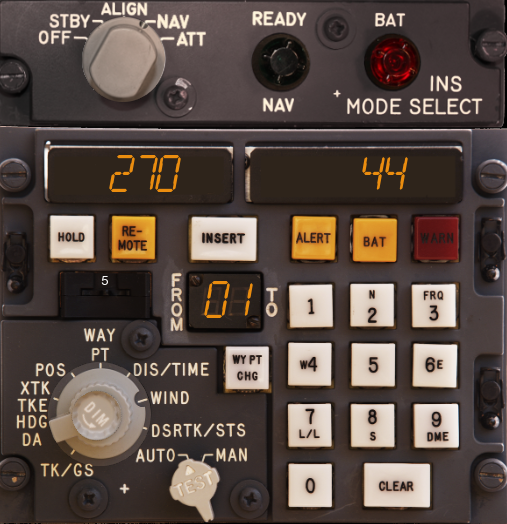
As described in a previous post PFPX determined we would have to expect an average enroute wind of 37 knots coming from 265°, used this value for fuel calculations and printed it into the flightplan (see Figure 1). Now, of course, this is just an average, but still let us compare it to the actual value we see in flight. And indeed, as can be seen in Figure 2, the current actual value measured somewhere™ in cruise actually matches the predicted value pretty closely. The CIVA INS can calculate the current speed and will show direction/speed in the displays when you turn the data selection knob to “Wind”.
This actually used to be a big problem with X-Plane, it just took METAR-reports for airports and did some interpolation inbetween them not really caring about the higher altitudes. The NOAA Weather Plugin developed by Joan Perez helps here and adds NOAA weather information in addition to the METAR reports for a more accurate weather representation in the higher altitudes. It used to cause a pretty abrupt condition change when switching between NOAA weather and METAR-reports, but this has been fixed with a recent update of the plugin, so make sure you use the newest version of it.
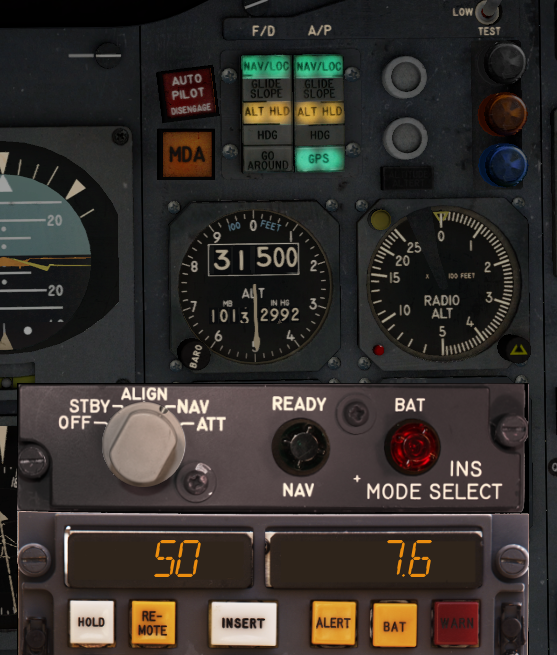
Eventually it is time to descent. I arbitrarily decide to start the descent 50 nautic miles out of TETAG, the first fix of the STAR I am taking, as you can see in the CIVA displays shown in Figure 3.
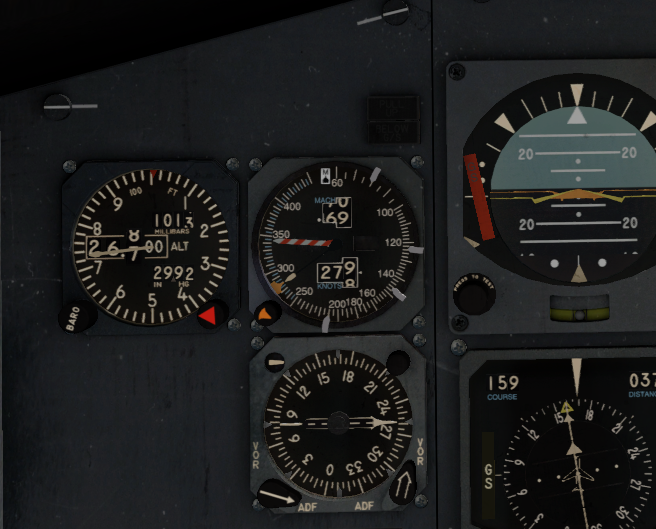
At about 27,000 feet altitude I can to switch from “Mach-mode” to “IAS-mode”. Since the Mach mode does not exist on the Boeing 737-200 it mainly means that I can now stop constantly adjusting the IAS speed bug.
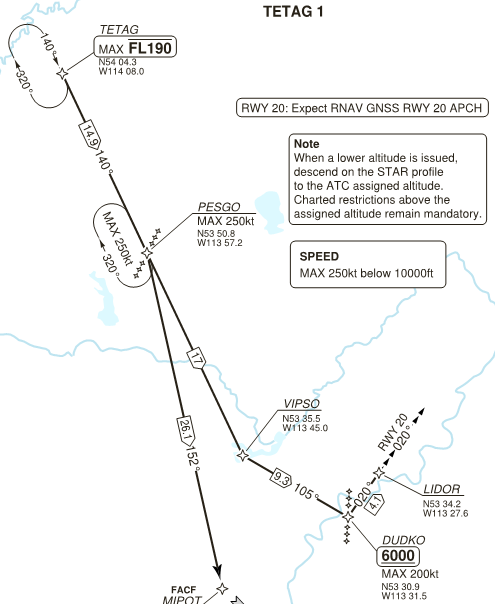
Figure 5 again shows the approach I will be taking (I already put it into the blog post about charts before). We are expected to reach TETAG at or below flight level 190, at PESGO we are expected to be slower or equal to 250 knots, at DUDKO we are expected to be at or above 6000 feet at or below 200 knots.
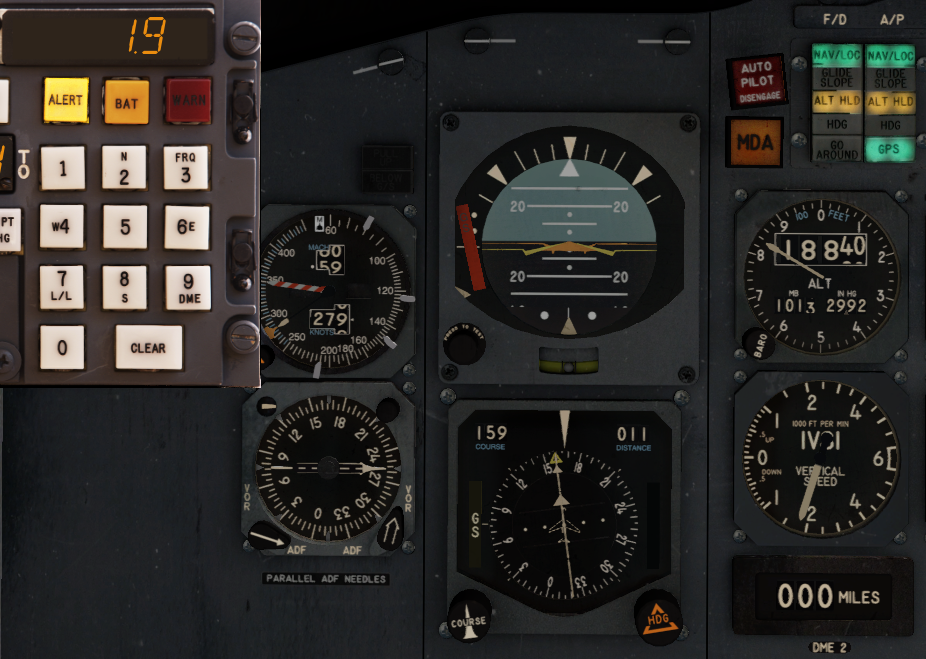
First we reach TETAG. At the time the screenshot shown in Figure 6 was taken we were still 11 nautic miles away from the waypoint but are already slightly below FL190.
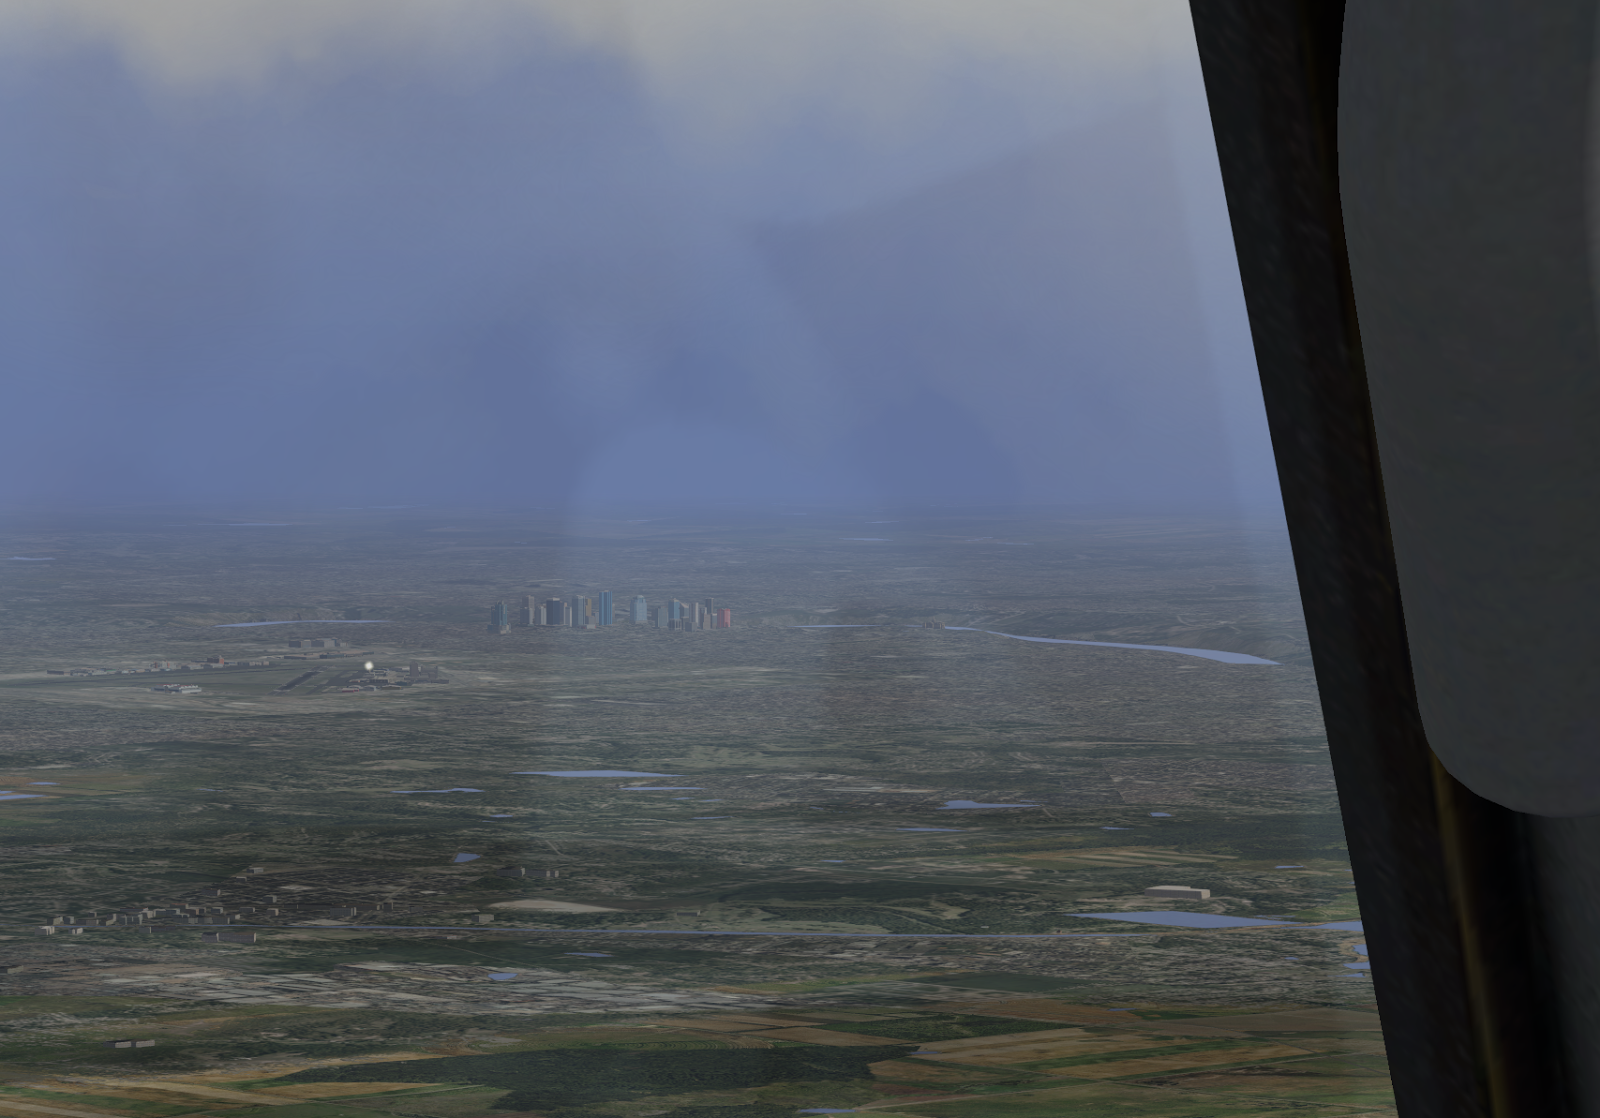
While we follow the quite unspectacular rest of the STAR, the Edmonton skyline appears to the left of the aircraft as can be seen in Figure 7.
After the LIDO waypoint I turn off the autopilot and continue on my manual approach. As the visibility is good enough, I opt to do a visual approach. The published instrument approach NDB would not be too different in handling, though.
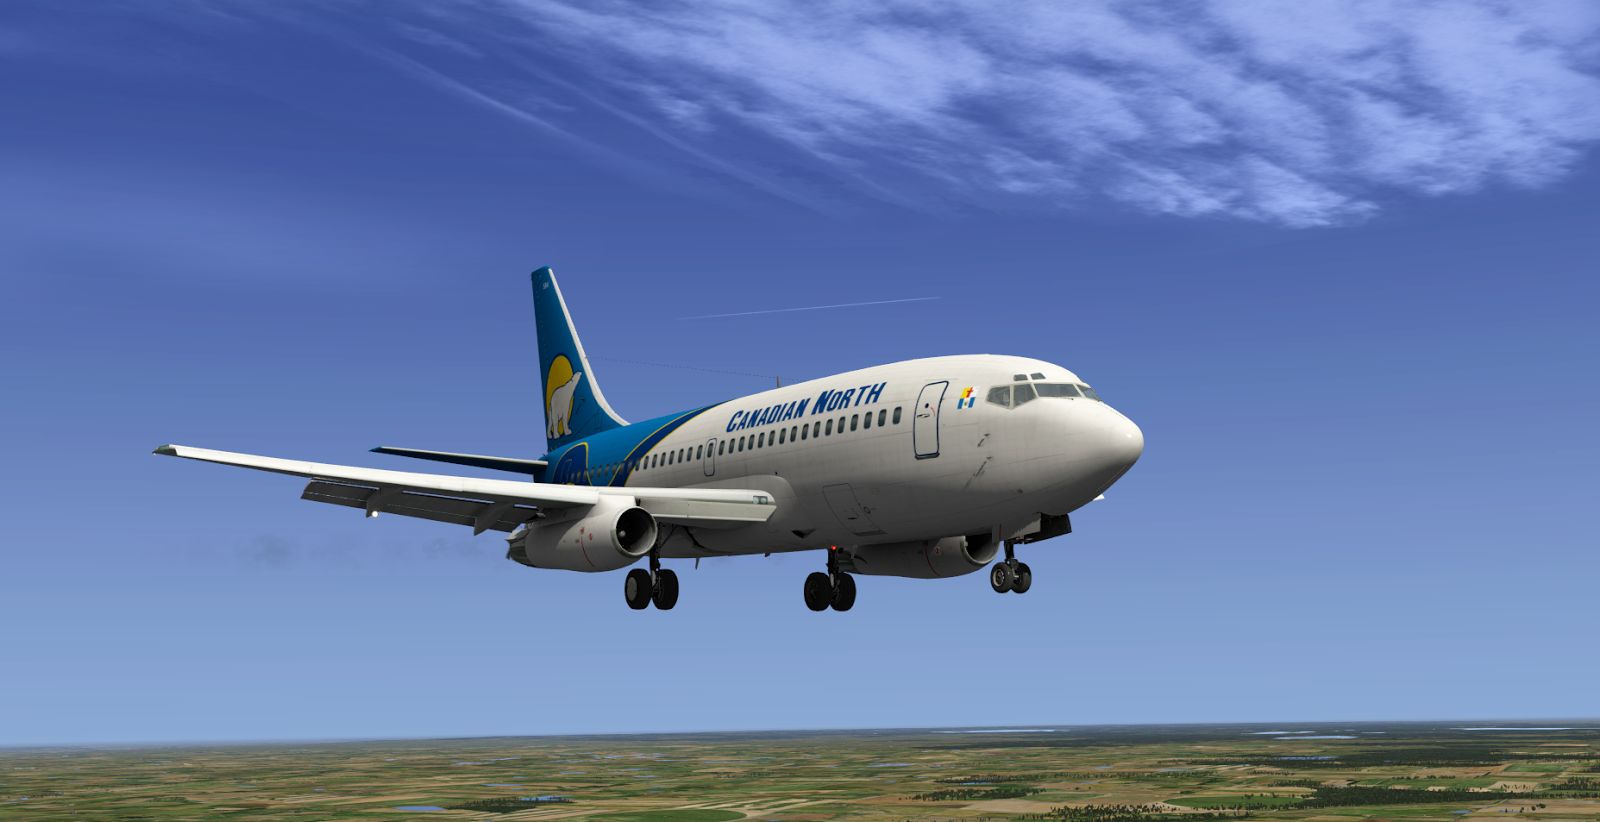
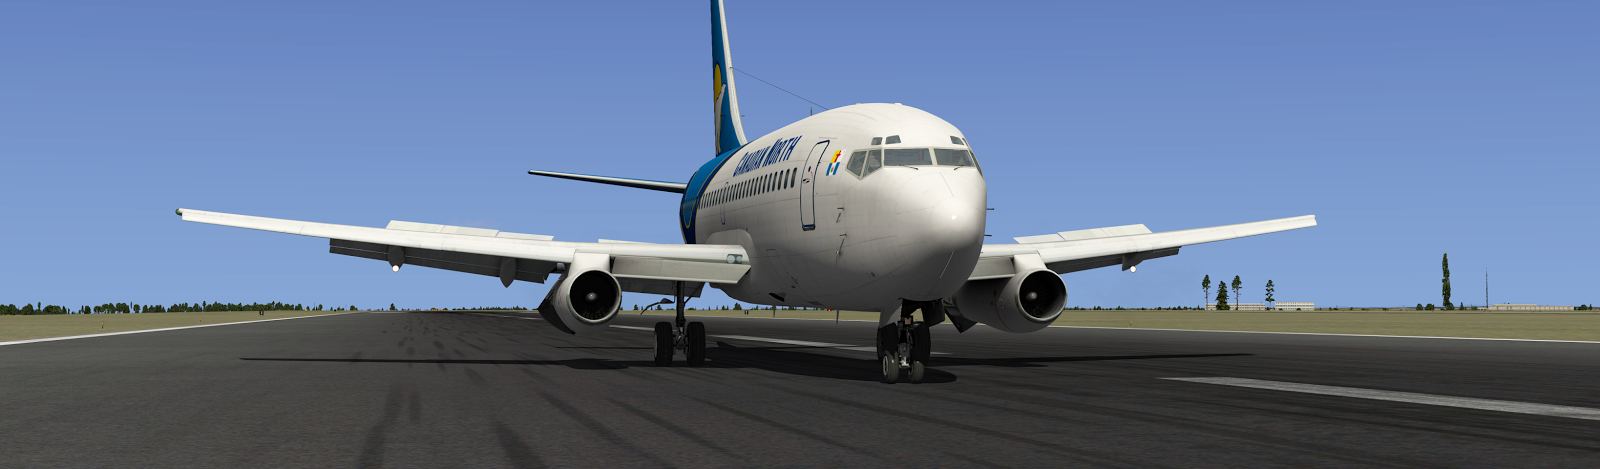
Figure 8 shows the aircraft in the “dirty” configuration ready to land.
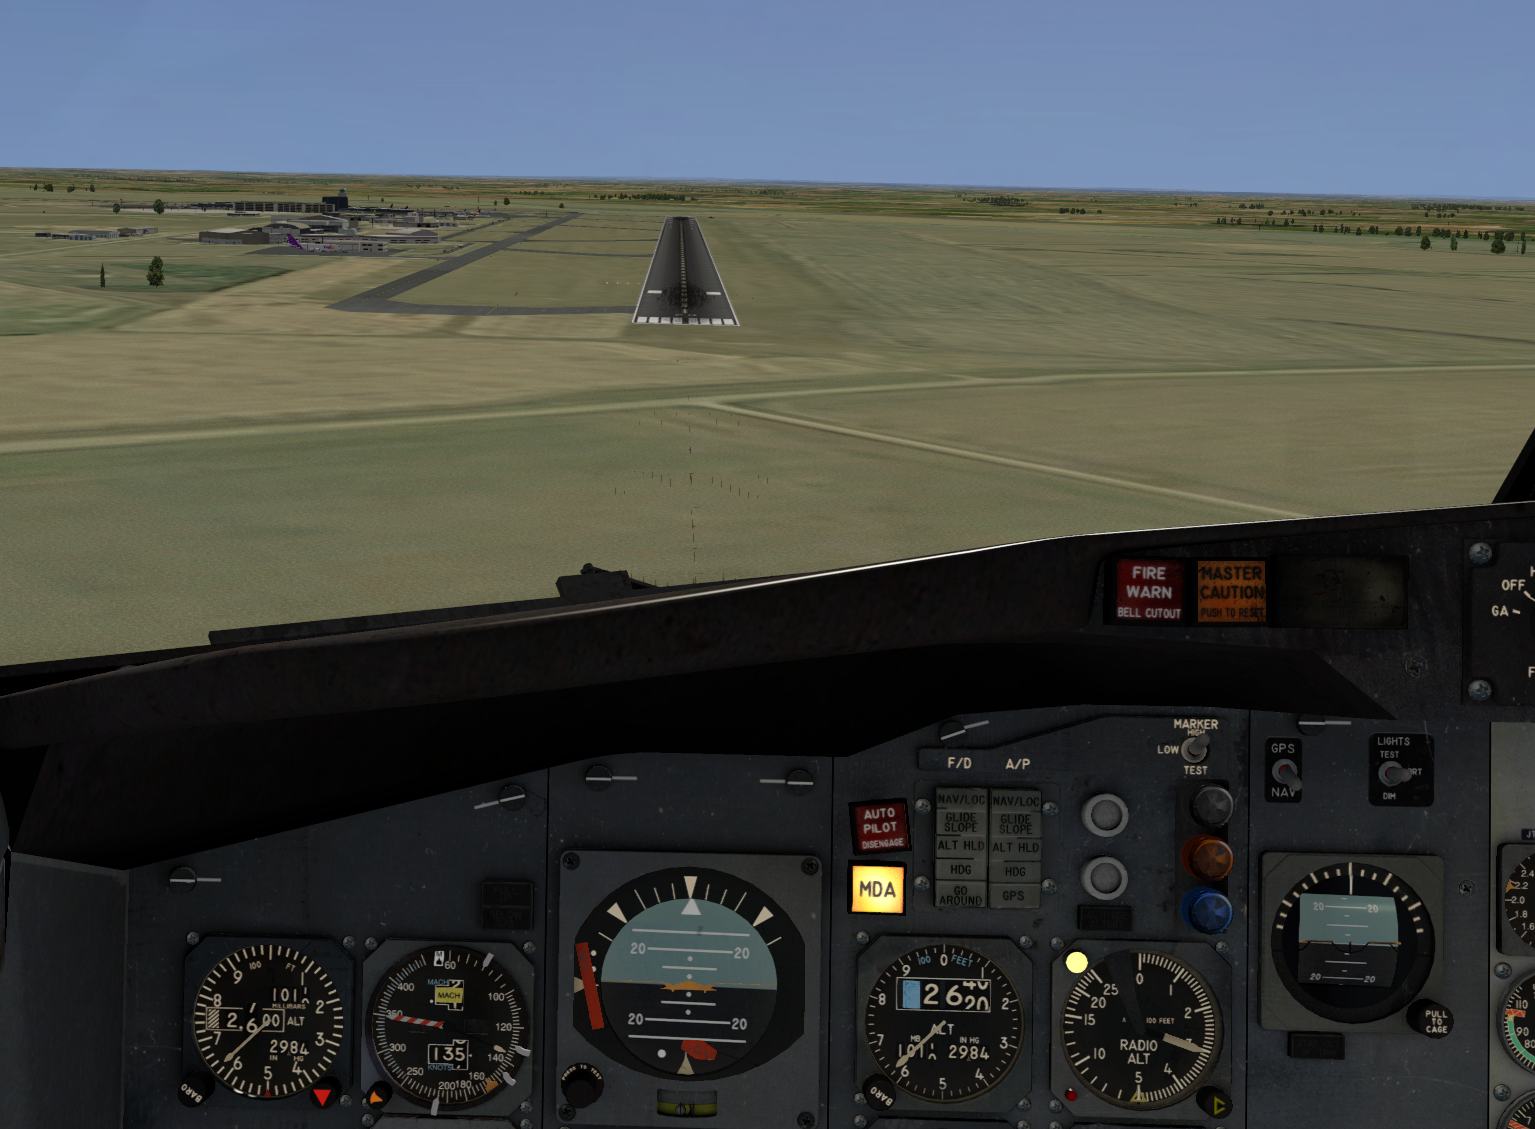
Figure 9 shows the pilot view right before landing, 300 feet above the field. The MDA light is signaling that if I had taken the instrument approach, I would now be at or below the minimum decision altitude.
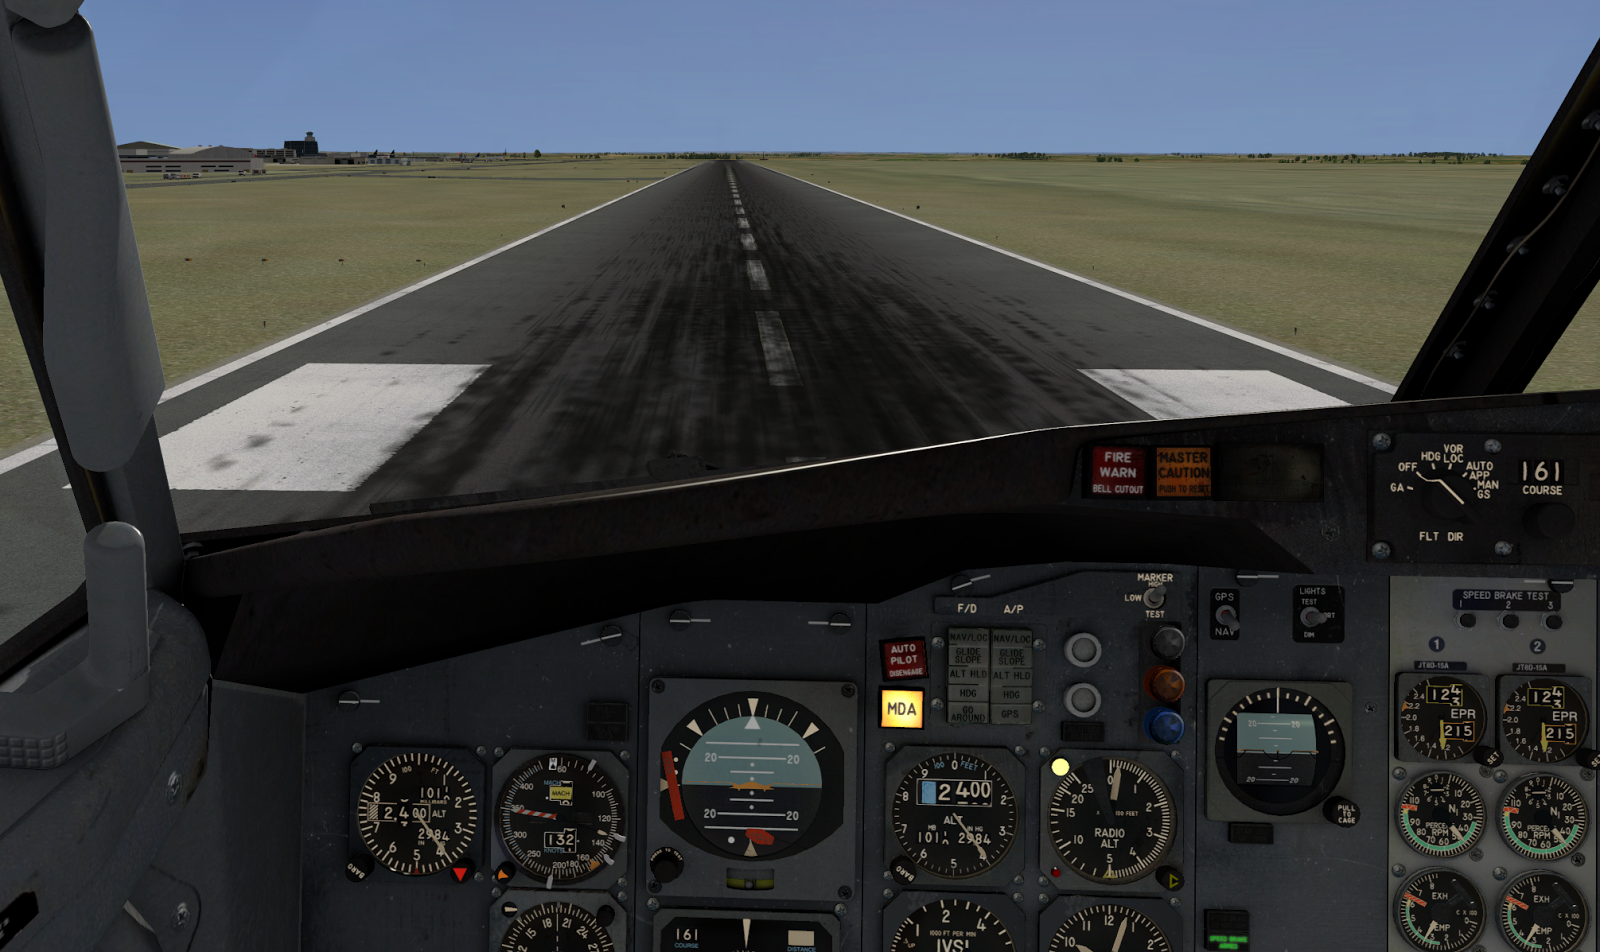
I decide to land of course and Figure 10 shows the pilot view right before touchdown. You can notice the green “Speed Brakes Armed” light below the back-up artificial horizon singalling the automatic speed brake deployment mechanism being active.
In Figure 11 you can see the speed brakes in their deployed form as well as the engines in reverse mode to slow the plane down after touchdown.
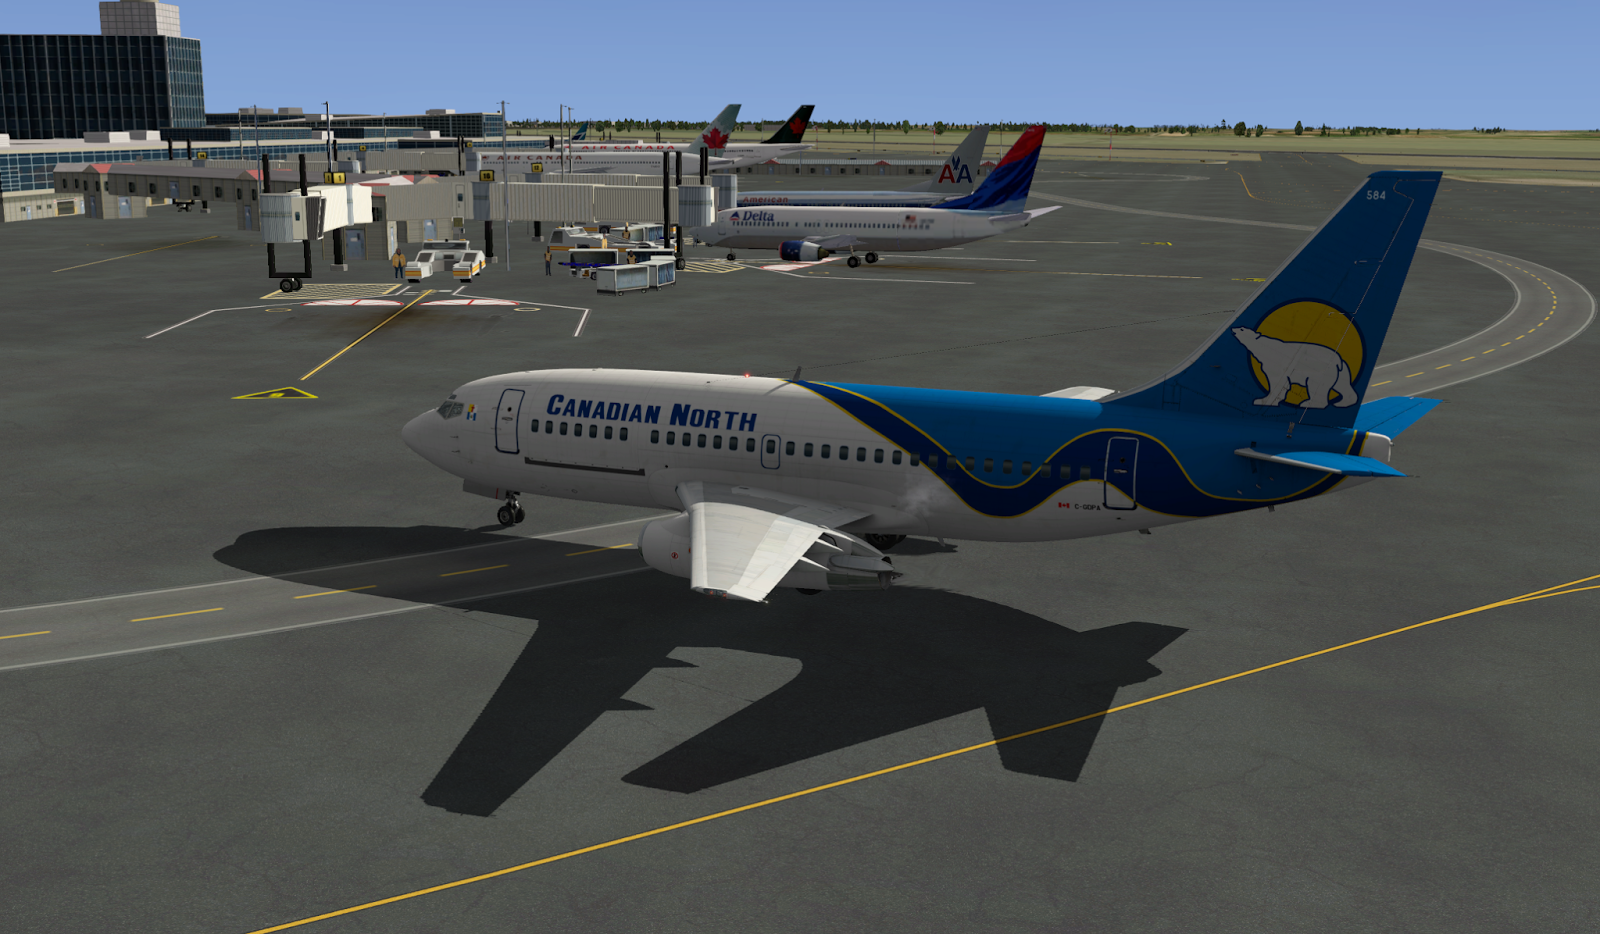
So finally we arrive savely at our gate in Edmonton International Airport.
The whole flight took me less than 2 hours to prepare and fly, most of which I actually spend in the aircraft and not doing the rather boring planning. My main point being: if you use the right tools for your needs and develop a fitting workflow, jetliner IFR-style flying does not necessarily need much more preparation time than your random VFR-flight.
In the next post I will provide a short summary and an overview of all the tools and plugins I used for this flight.